Statistics
Visualize your data. Data visualization allows you to create and customize graphs and charts to see an overview of your productivity. Compare time spent on different projects to better allocate your time and efforts.
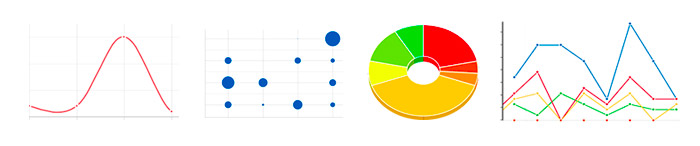
- Pie Charts
- Line Graphs
- Bubble Charts
- Budgeting
- Completion Time
- Task Age