Statistics
These graphs will help you keep track of your progress and identify where you might want to focus your attention in the future.
Pie Charts
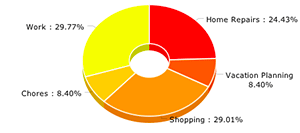
This customizable pie chart will allow you to visually see the size of various groups of tasks. You can select how you want your tasks grouped, and how you want the groups to be calculated.
Learn moreLine Graph

With this line graph you can see how many tasks were added, modified, completed, due or started on each day. You can filter and segment the graph by a variety of parameters.
Learn moreBubble Chart
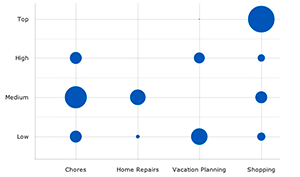
With the Bubble Chart, you can pick any two fields for your X-axis and your Y-axis and quickly see how many tasks are in each intersection.
Learn moreBudgeting
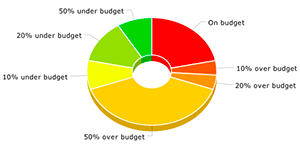
This chart is for people who use the "length" field to estimate a project's length and the "timer" field to track the actual time spent. The chart will show how good you are at estimating the actual time spent.
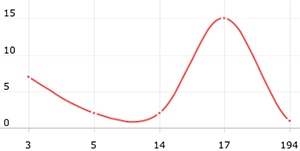
Learn moreCompletion Time

This graph shows how long it takes for you to complete a task once it has been added to your to-do list.
Learn moreTask Age
This graph shows how old your tasks are, counted from when you added them to your to-do list.
Learn more